Japanese Yen Ticks Up As Nervy USDJPY Hovers Around Intervention Levels
Download our new Q3 Yen Forecast
The Japanese Yen remains close to forty-year lows against the United States Dollar on Thursday. However, it has inched up through the session, with a nervous market wondering how much lower it can go without attracting some more official attention.
The authorities in Tokyo intervened to prop their currency up in May when it last spiked up to current levels. However, the market was then thinned by a local holiday, increasing the action’s impact. There hasn’t been any sign of a repeat so far but traders seem reluctant to push
USD
/JPY much higher. Note, though, that the latest rise has been more orderly and so, perhaps, less likely to see Tokyo step in.
Of course, interest-rate differentials still favor the greenback and, indeed, just about everything else against the Yen. That will remain so even if US interest rates are likely to fall this year.
The Bank of Japan gingerly exited its decades-long zero-interest rate policy in March thanks to signs that long-dormant local
inflation
was at last internally generated rather than merely a function of global trends. But the Yen won’t see truly competitive interest rates for a very long time if indeed it ever does. The BoJ may tighten its monetary settings again at the end of this month given resilient inflation and some upbeat sentiment from major Japanese companies in the latest important ‘Tankan’ survey.
However, while the fundamentals will continue to favor the Dollar for some time, the technical picture for USD/JPY is starting to look overstretched, as we will see below.
There’s nothing much on the Japanese data calendar likely to move the currency this week, which will leave USD/JPY like most other markets hunkered down for Friday’s crucial official labor market data.
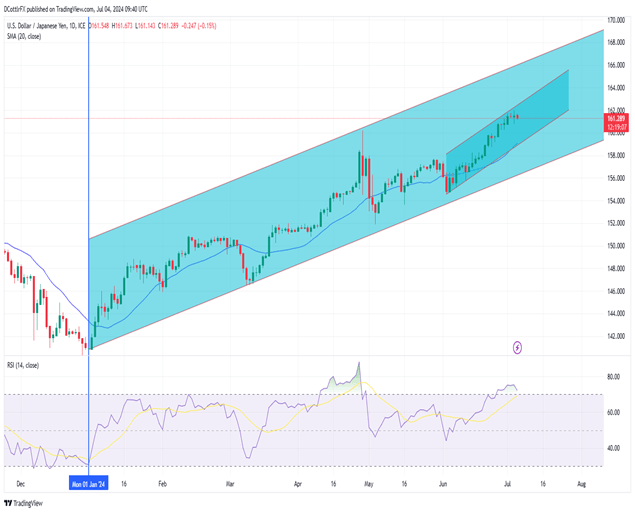
USD/JPY Daily Chart Compiled Using TradingView
The broad uptrend in place for all of this year looks very much entrenched, with a narrower, near-term channel from the start of June also not obviously threatened.
However, USD/JPY now looks unsurprisingly overbought to judge by its Relative Strength Index. That’s hovering around the 70-level which suggests some froth at the top of the market. Perhaps more worryingly for Dollar bulls, the pair is now close to an astonishing 40 full Yen above its 200-day long-term average.
With both of these in mind, it’s surely arguable that the path of least resistance. Reversals could find support around the 20-day moving average which is much closer to the market now at 158.52. Before that comes channel support at 159.11.
--By David Cottle for DailyFX
Japanese Yen (USD/JPY) Analysis and Charts
Japanese Yen Technical Analysis

Change in
Longs
Shorts
OI
Daily
6%
2%
2%
Weekly
13%
-5%
-2%
